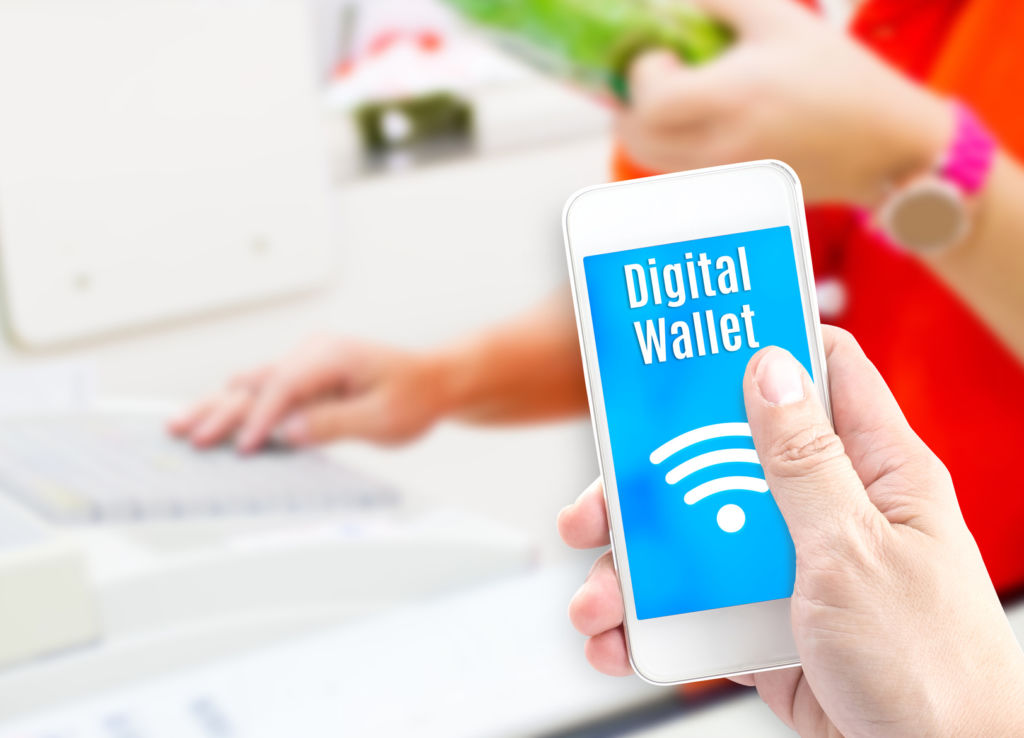
It’s true: The Girl Scouts actually sold more cookies when they began to take mobile payments. It makes perfect sense—you never know when or where you’re going to bump into a sidewalk table filled with Thin Mints and Tagalongs, and you might not be prepared. But the lack of cash is no longer an obstacle to taking a few boxes of that tasty goodness home, as long as you have your phone handy.
Whether they’re prepared to spend money or not, an increasing number of consumers are embracing the idea of using a mobile device to pay for goods and services. It’s faster, more convenient, and often linked to valuable rewards and discounts. But don’t take our word for it. We dug around for some mobile payment statistics that paint a picture of where things are headed and how far the industry has come. It seems the mobile payment market has a bright future, as will forward-thinking retailers with an eye toward continually improving the customer experience.
Is your checkout process losing customers? Use this simple checkout conversion calculator to uncover points of friction—and see how you stack up against your competitors.
Mobile Payment Market Share Statistics
- In-store mobile payments will reach $503 billion by 2020, reflecting a compound annual growth rate (CAGR) of 80% between 2015 and 2020. (BI Intelligence)
- The number of in-store mobile payment users in the U.S. is predicted to reach 150 million by the end of 2020—which will represent 56% of the consumer population at that time. (Mobile Payments World)
- Mobile point-of-sale revenue around the world is expected to reach almost $50 billion in 2021, (from just $6.6 billion in 2016); one in every three point-of-sale terminals will accommodate mobile. (Juniper Research Via Reuters)
- Thanks in large part to more smartphones and tablets in emerging countries, the mobile payment technologies market around the globe is expected to increase at a CAGR of 20.5% between the years of 2016 and 2024. In 2015, it was valued at $338.72 billion; the 2024 projection is $1,773.17 billion. (Transparency Market Research)
- In the U.S. in 2016, there were 232 million smartphones in use; 16.5% of those were used to make a contactless payment the same year. (Juniper Research)
- Fifty percent of all surveyed American retailers planned to incorporate near field communication (NFC) technology (which enables contactless payments) into their stores by the end of 2016 or had already done so. (Financial Times)
Mobile Payment User Statistics
- In the U.S., mobile wallets are expected to surpass the use of both credit and debit cards by 2020. (WorldPay)
- In the U.S., the majority of people already using mobile payments are just over age 30, have an average yearly income of $70K, and spend nearly twice as much on retail as nonusers.
- Seventy percent of millennials identified rewards and/or discounts as the most compelling motivational factors for making mobile payments. (Pew Charitable Trusts)
- Most commonly, people make mobile payments through a smartphone web browser or a downloaded app. (Pew Charitable Trusts)
- In 2016, U.S. Consumers bought $47.6 billion of physical goods via remote mobile payments. (Juniper Research)
- Thirty-nine percent of U.S. consumers say they would use mobile payments more frequently if more stores and apps accommodated it. (NFC World)
Mobile Payment Security Statistics
- Security ranks high on the list of obstacles to mobile payment use, with 70% of the U.S. population noting it as a concern. (Pew Charitable Trusts)
- Forty-seven percent of polled cybersecurity professionals have doubts about the security of mobile payments, and only 23% are confident that the personal information used in association with mobile payments is safe. Eighty-nine percent agree that cash is the most secure payment method available, but only 9% prefer to use it. (Business 2 Community)
- The greatest security vulnerability associated with mobile payments is public Wi-Fi (26%), followed closely by lost or stolen devices (21%). (ISACA)
Mobile Payment Global Statistics
- Eighty percent of Americans have never used a contactless payment system, compared to approximately 80% of Australians and Brits who have. (Recode)
- The British are leading adoption of mobile payment, with 74% of that population using a mobile device to make payments and manage their finances. On the whole, mobile payment use across the continent of Europe significantly increased last year, jumping 200% from 2015 (18%) to 2016 (54%). (Mobile Payments World)
- In 2016, mobile payment activity in China was nearly 50 times greater than in the U.S. The number of Chinese mobile payments is expected to multiply by 7.4 times between 2015 and 2019. (Financial Times)
- Europeans ages 55-64 comprise the group with the fastest growth rate for mobile banking adoption. (Visa)
- Forty-three percent of British consumers feel equally comfortable buying high-value items, like vacations and electronics, on a mobile device as they do conducting small transactions, like purchasing bus or train tickets (41%). (Visa)
- Swedes used cash for barely 2% of all payments made in the country in 2016; that figure is expected to drop to 0.5% by 2020. Popular mobile phone apps like Swish have been adopted by nearly half the Swedish population and are used to make more than 9 million payments a month. (Guardian)
- The MobilePay app was used by over three million Danes (the country’s total population is 5.6 million) to make some 90 million transactions in 2016. (Guardian)
Psyched about mobile payment yet? If you’d like to learn more about how mobile wallets in particular can benefit your business, check out our blog.
Related Resources:


